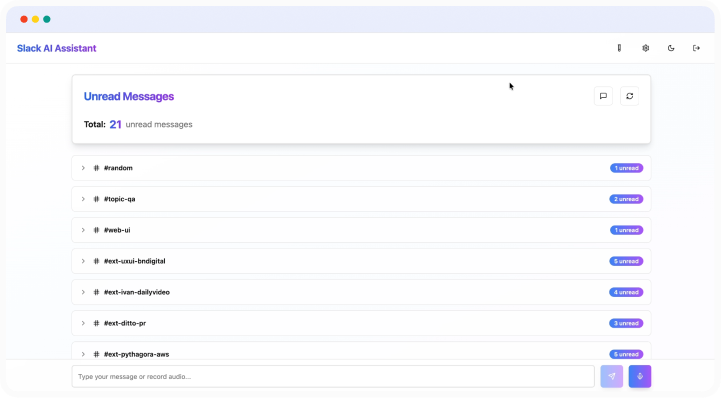
GitHub Team Metrics Dashboard
GitHub analytics require manual tracking or expensive third-party tools
You need to see how your development team is performing but GitHub doesn't give you the overview you need. Counting merged PRs per week means clicking through pages of data. Finding stale branches requires checking each one manually. Understanding PR cycle time involves spreadsheet calculations. Third-party analytics tools cost thousands annually for features you barely use.
About this tool
This dashboard connects to GitHub and shows team workflow patterns. Get PR leaderboards by developer, visibility into open and stale PRs, and tracking for branches without commits. Average merge times show where PRs get stuck. Weekly charts compare closed PRs against release frequency.
Built with GitHub integration, PR and branch tracking, merge time analysis, and stale work alerts, ensuring team visibility with weekly metrics and MongoDB storage.GitHub integration with token authentication, weekly metrics with expandable views, stale branch identification and tracking, developer leaderboard by merged PRs, four chart types (merged PRs, releases, closed PRs, time-to-close), active vs stale PR breakdown, branch owner avatars, and direct GitHub links from branches.
Weekly standups have actual metrics instead of vague updates. Stale branches get cleaned up because they're visible. PR bottlenecks surface through time-to-merge data. Team performance becomes measurable without manual tracking.
Prompts used to build this app
I want to create a GitHub dashboard that will enable me to have a dashboard of all the GitHub metrics from my team. It needs to have three different pages. The first one should be a homepage and it should show expandable list items, one below each other, per week. And for each week in the collapsed view, it should show the number of releases. This should be the most prominent number. And the leaderboard, like the number one, number two, and number three, spots of developers who had the most PRs merged by them that week. The second page should be branches and it should show the number of active branches that we have right now and the number of stale branches. And the stale branch should be a branch that had the last commit more than one week ago. And stale branches should be the most prominent. The view on the top, there should be a number of total branches, number of stale branches, and below there should be two sections, a list of active branches and stale branches, and I should be able to click on each of those and open it up on GitHub. Also, next to each branch, I want to see who had the last commit in that branch, which developer, and their thumbnail or their avatar from GitHub. And finally, we have the charts view, the charts page. It should show four different charts, one below each other. First one is the number of merged PRs per week. So the x-axis should have weeks and the y-axis should be the number of merged PRs. Another chart is number of releases per week. The third one is number of closed PRs per week. That means a PR that was closed and not merged. And final chart should be time to close a PR. That means the time from when the PR was opened until the time when it was closed, and it should be per week. So for all PRs that were merged that week, how many of them, or the average time between the opening the PR and the closed PRs for the closed PRs that week. Also, I want to add on the top of the homepage, I want to add four different numbers, four different metrics. They should be the most prominent ones. The first one should be that the number of open PRs, the number of stale PRs, that is a PR that was opened more than one week ago. And inside that number there should be the number of draft PRs that are stale and number of active PRs that are stale. Then the number of branches and the number of stale branches by the formula that I already explained. And that's pretty much it. Also in the chart, time to close a PR, don't count the draft PRs between the opening and closing, but only PRs that were open.
Don’t Miss Out


